Screenshots


App details
- Version
- 2.0.1
- Size
- 2.80 MB
- Updated
- June 12, 2024
- Requires
- Windows 11
- Language
- English | Spanish
- License
- Full
- Developer
- David Hinkle
- Category
- Windows OS
SoftPas in:
This product is also available in the following languages:
About BandwidthD
Download BandwidthD – Free Network Subnet Tracker for Windows & Unix
Overview
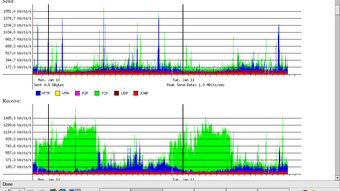
BandwidthD is a lightweight yet powerful network‑subnet tracker designed for IT professionals, network administrators, and hobbyists who need clear visibility into TCP/IP traffic across their environments. Unlike generic bandwidth monitors that only show aggregate usage, BandwidthD dives deep into each subnet and even individual IP addresses, producing high‑resolution HTML reports that illustrate utilization trends over multiple time frames—2 days, 8 days, 40 days, and an impressive 400‑day horizon. The tool captures traffic in intervals as short as 3.3 minutes, giving you near‑real‑time insight while still supporting longer 12‑hour logging cycles for long‑term capacity planning.
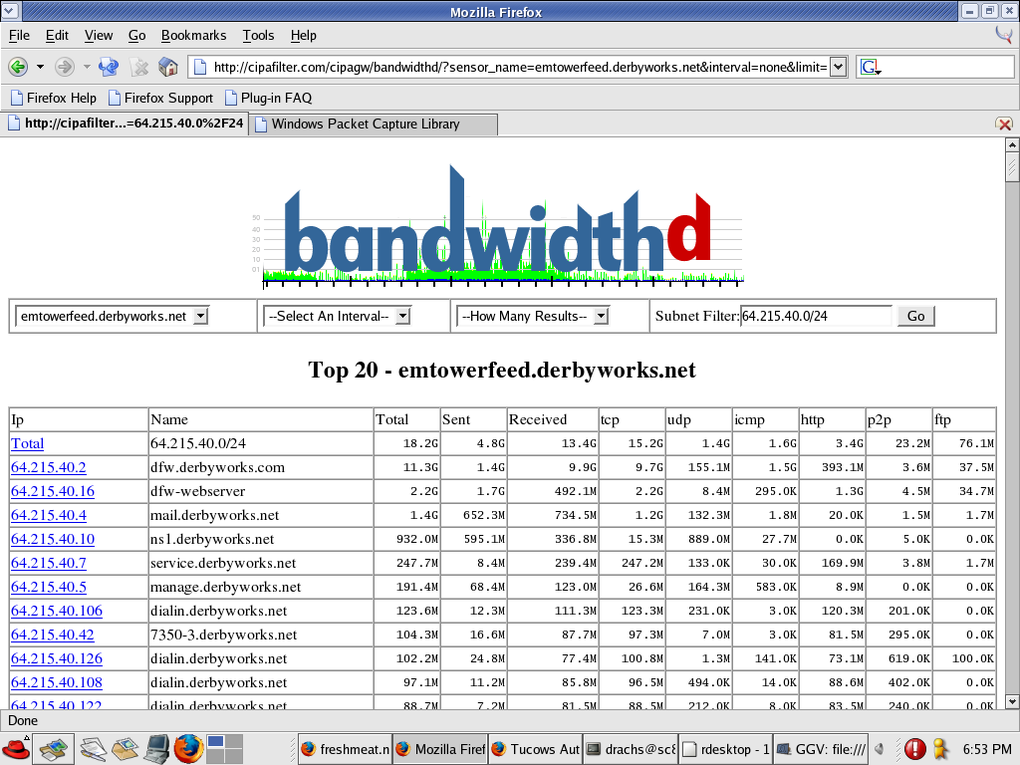
What sets BandwidthD apart is its intuitive colour‑coding scheme. HTTP, TCP, UDP, ICMP, VPN, and P2P streams each receive a distinct hue, making it effortless to spot protocol‑specific spikes or anomalies without digging through raw packet captures. The generated graphs are rendered as PNG images and embedded in static HTML pages, allowing you to host the reports on any web server or view them locally on a workstation. For larger deployments, BandwidthD can operate in a sensor mode, feeding raw utilisation data into a backend database (MySQL, PostgreSQL, or SQLite). From there, a dynamic PHP front‑end can query the database and display live charts, giving you the flexibility to scale from a single‑machine setup to a multi‑sensor, enterprise‑grade monitoring solution.
Installation is straightforward on both Windows and Unix‑like platforms. On Unix systems the only external dependencies are the well‑known libpcap (for packet capture), libgl (for graphics rendering), and libpng (for image creation). Windows users benefit from pre‑compiled binaries that bundle the necessary libraries, eliminating the need for a separate compilation step. Whether you run BandwidthD as a standalone application that produces a new HTML report every 200 seconds, or as a background sensor that streams data to a remote database, the tool remains secure—traffic data never leaves the host unless you explicitly configure a database export, and all files are written with standard file‑system permissions.
Key Features and Capabilities
- Multi‑Period Graphs: Visualise bandwidth consumption over 2‑day, 8‑day, 40‑day, and 400‑day intervals, helping you identify short‑term bursts and long‑term growth patterns.
- Per‑IP Address Breakdown: Detailed charts for each host within a subnet, allowing pinpoint diagnosis of a single machine’s impact on overall traffic.
- Protocol Colour Coding: Automatic colour separation for HTTP, TCP, UDP, ICMP, VPN, and P2P traffic, simplifying protocol‑level analysis.
- Flexible Logging Intervals: Choose from 3.3‑minute to 12‑hour logging windows, stored in CDF format or sent directly to a backend database.
- Static HTML & PNG Output: Generates self‑contained reports that can be served from any web server without additional software.
- Sensor Mode for Centralised Reporting: Stream data to MySQL, PostgreSQL, or SQLite for dynamic PHP dashboards.
- Cross‑Platform Support: Native binaries for Windows; source code for Unix (Linux, BSD, macOS) requiring only libpcap, libgl, and libpng.
- Lightweight Resource Footprint: Runs comfortably on modest hardware—typical CPU usage stays below 5 % and memory consumption under 50 MB.
- Secure By Design: No outbound network connections unless you configure database export; all logs are stored locally with standard file permissions.
- Open‑Source License: Free to download, modify, and redistribute under the GPL‑2.0 license.
Beyond the listed capabilities, BandwidthD offers a number of hidden gems that make daily monitoring painless. For example, the HTML reports include a navigation sidebar that automatically groups subnets by CIDR range, letting you jump from a /24 network to a /16 view with a single click. The PNG charts are generated using anti‑aliased vector graphics, ensuring crisp lines even on high‑resolution displays. Additionally, the tool can output raw utilisation data in CSV format, which can be imported into Excel or Power BI for custom reporting.
When operating in sensor mode, BandwidthD automatically timestamps each record with both epoch time and a human‑readable ISO‑8601 string, making it easy for downstream scripts to perform time‑based aggregations. The built‑in PHP reporting templates support pagination, search, and export to PDF, giving you a turnkey solution for delivering bandwidth usage reports to management without writing a single line of code.
Installation, Configuration, and Compatibility
Step‑by‑Step Installation on Windows
- Download the latest Windows installer from the official BandwidthD website.
- Run the
BandwidthD‑setup.exeand follow the wizard. The installer automatically places the executable inC:\Program Files\BandwidthDand adds the directory to your system PATH. - During installation, you will be prompted to select a data storage option: Local HTML/PNG or Database Sensor. Choose “Local” if you want standalone reports, or “Database” if you plan to aggregate data centrally.
- After the wizard finishes, open a Command Prompt with administrator rights and type
bandwidthd --helpto verify the installation. - Optionally, create a scheduled task that runs
bandwidthd -i 200at system startup to generate a new report every 200 seconds.
Installation on Unix/Linux/macOS
For Unix‑like systems, BandwidthD is distributed as source code. Follow these commands (requires gcc or clang, make, and the three libraries mentioned earlier):
sudo apt‑get install libpcap-dev libgl1‑mesa‑dev libpng-dev   # Debian/Ubuntu
# or
sudo yum install libpcap-devel mesa-libGL-devel libpng-devel # RHEL/CentOS

wget https://bandwidthd.org/releases/bandwidthd‑latest.tar.gz
tar -xzf bandwidthd‑latest.tar.gz
cd bandwidthd‑latest
./configure --enable‑sensor   # add --enable‑sensor if you want DB mode
make
sudo make install
After installation, the binary resides in /usr/local/bin/bandwidthd. Run bandwidthd --version to confirm a successful build.
Configuration Basics
BandwidthD uses a simple bandwidthd.conf file located in the installation directory. Key parameters include:
INTERVAL: Capture interval in seconds (default 200).OUTPUT_DIR: Destination folder for HTML and PNG files.DB_HOST,DB_USER,DB_PASS,DB_NAME: Database connection details when sensor mode is enabled.SUBNETS: List of CIDR blocks to monitor (e.g.,192.168.0.0/24,10.0.0.0/8).
After editing the config, restart the service with systemctl restart bandwidthd on systemd‑based Linux, or simply relaunch the executable on Windows.
Operating System Compatibility
BandwidthD officially supports:
- Microsoft Windows 7, 8, 10, 11 (both 32‑bit and 64‑bit)
- Linux distributions with kernel 2.6+ (Debian, Ubuntu, Fedora, CentOS, Arch, etc.)
- BSD variants (FreeBSD, OpenBSD)
- macOS 10.12 Sierra and later (compiled from source)
The only mandatory dependency across all platforms is libpcap, which provides the raw packet capture capabilities. On Windows, libpcap is bundled as WinPcap/Npcap, so you do not need to install anything extra.
Once installed, you can verify that BandwidthD is capturing traffic by checking the first generated HTML page (index.html) in the output directory. The page will display a real‑time graph of the total bandwidth, along with colour‑coded slices for each protocol.
Pros, Cons, Frequently Asked Questions, and Final Verdict
Pros
- Free and open‑source, with no hidden fees.
- Provides per‑IP and per‑protocol breakdowns, which many commercial tools lack.
- Static HTML reports are easy to share and require no additional software to view.
- Sensor mode enables centralised data collection for large networks.
- Low system resource consumption; suitable for embedded devices.
- Cross‑platform support for Windows, Linux, BSD, and macOS.
Cons
- No native mobile app; reports must be accessed through a browser.
- Initial configuration can be intimidating for users unfamiliar with libpcap.
- Graphing library is basic; lacks interactive zoom or hover‑tooltips.
- Database sensor mode requires manual setup of MySQL/PostgreSQL.
Frequently Asked Questions
Can BandwidthD monitor encrypted VPN traffic?
Yes. While BandwidthD cannot decrypt the payload, it can still recognise VPN packets by their protocol identifiers (IPSec, OpenVPN, WireGuard) and colour‑code them separately, allowing you to see how much bandwidth the VPN tunnel consumes.
Is there a way to export the data to CSV for custom analysis?
Absolutely. By adding EXPORT_FORMAT=csv to bandwidthd.conf, the tool writes a daily CSV file containing timestamp, IP address, protocol, and bytes transferred. This file can be imported into Excel, Power BI, or any data‑science platform.
Does BandwidthD support IPv6?
Yes. IPv6 traffic is captured and displayed alongside IPv4. The HTML reports group subnets by address family, and the colour‑coding applies equally to IPv6 flows.
How secure is the data when using sensor mode?
Sensor mode only transmits raw utilisation metrics (bytes per interval). No packet payloads or personally identifiable information are sent. You can further secure the connection by configuring the database to accept connections over SSL/TLS.
Can I schedule automatic cleanup of old HTML reports?
Yes. BandwidthD includes a built‑in retention setting (MAX_DAYS) in the configuration file. Setting MAX_DAYS=90 automatically deletes reports older than 90 days. On Unix you can also use a cron job that runs find /path/to/reports -type f -mtime +90 -delete.
Final Verdict and Call‑to‑Action
BandwidthD delivers exactly what its name promises: a detailed, reliable, and free tool for tracking bandwidth across subnets and individual hosts. Its combination of static HTML reporting and optional sensor‑to‑database mode makes it versatile enough for small home labs as well as medium‑size enterprise networks. While the UI is intentionally simple and lacks the polish of commercial dashboards, the clarity of its colour‑coded graphs and the low overhead on system resources are hard to beat. If you need a secure, open‑source solution that runs on both Windows and Unix without demanding a hefty license fee, BandwidthD is a solid choice.
Ready to gain instant insight into your network’s utilization? Download BandwidthD now, follow the quick installation guide above, and start generating actionable bandwidth reports within minutes. Your network performance will thank you.
Guides & Tutorials
How to install BandwidthD
- Click the Download button above.
- Once redirected, accept the terms and click Install.
- Wait for the BandwidthD download to finish on your device.
How to use BandwidthD
This software is primarily used for its core features described above. Open the app after installation to explore its capabilities.
User Reviews
No reviews yet. Be the first to share your experience.
You may also like
moreLlama 2
Free-to-use large language model As the new addition to Meta’s arsenal of langua...
NotebookLM
Revolutionizing the note-taking and idea-generation process NotebookLM is an exp...
Github co pilot
AI-inspired software development and coding platform GitHub Copilot is a browser...
Google Gemma
Google’s lightweight AI models Introducing Google Gemma , a family of cutting-ed...
AI Image Enlarger
A free app for Windows, by ai-image-larger. AI Image Enlarger is a free software...
DALL E
AI-driven text-to-image transformation engine DALL·E is a free graphic and desig...